![]()
Q1 2022 – Summary
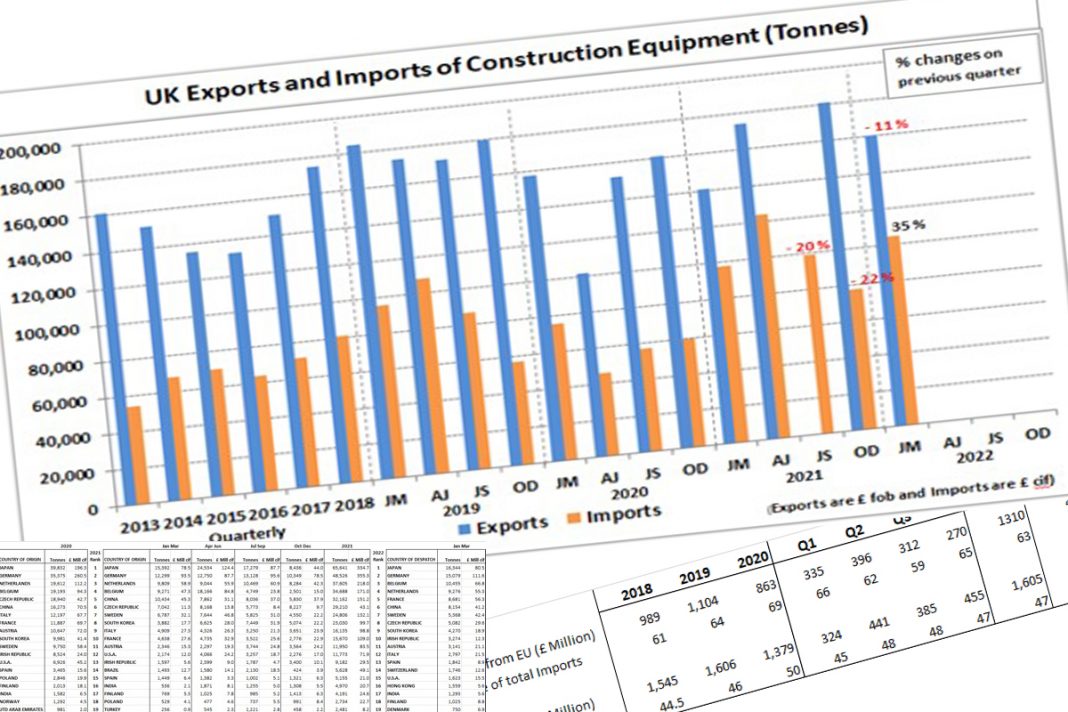
In the first quarter of 2022, imports and exports of construction and earthmoving equipment both recorded very high levels of trade, but showed different patterns compared with the previous quarter.
Imports showed an exceptional 54% increase on the previous quarter and matched the “record” quarterly level seen in Q2 last year, since trade has been monitored from 2013. This saw imports at £637 million in Q1, and was consistent with equipment sales in the UK remaining at very high levels in the first quarter of the year.
In contrast, exports saw a 9% decline in Q1 compared with the previous quarter, but this was a comparison with the highest quarterly level reached in Q4 last year since trade has been monitored since 2013.
While imports showed a 54% increase in £ value terms in Q1, the increase on a tonnage shipped basis was 35% compared with Q4 2021. This significant difference can be attributed to the higher prices being seen for equipment due to increases in the price of steel and some other products used in machine manufacture.
The EU share of total imports in Q1 saw a recovery to 69%, returning to the levels seen in 2020. This followed a reduced level of 63% in 2021, which was attributed to a post Brexit effect.
Exports of equipment in Q1 were £893 million, as highlighted above. This represented a reduction on Q4 2021 levels, but was still one of the highest quarterly totals in recent years.
The share of exports to the EU remained on a downward trend in the first quarter, falling to 42%, after being at 47% in 2021. After EU share of exports had shown a growing trend in earlier years, the reduced levels in 2021 and Q1 this year could be attributed to a post Brexit effect. An update on total tonnages shipped in 2021 still isn’t available for this report due to problems with some of the tonnage data in Q3, which haven’t been corrected by customs yet.
The UK remained a net exporter of construction and earthmoving equipment in Q1 2022, with exports (£893 million) 40% higher than imports (£637 million). However, this was a much smaller margin than in 2021 overall, when exports were 64% higher than the level of imports.
The table below provides a summary of the EU share of total imports and exports of equipment for the last four years and the first quarter of 2022. In Q1, the EU share of trade showed a different pattern for imports and exports. For imports, Q1 showed a significant increase to 69% compared with 2021, returning to 2020 levels. In contrast, EU share of exports continued to show a falling trend in Q1, reaching 42%, lower than the previous four years.
EU share of UK trade:

UK trade by £ value

UK trade by machine weight

Exports of Equipment by Country of destination
In Q1 2022, UK exports of equipment were shipped to over 140 different countries. The table below shows rankings for the Top 20 countries based on weight of machines shipped (tonnes) since 2020. However, for 2021, the country ranking has been switched to a £ value basis due to the problem with tonnage shipped data from customs highlighted above. In Q1 2022, the Top 20 countries accounted for just over 80% of total exports on both a value and tonnage shipped basis.
The USA remained the top destination for UK exports during Q1 2022, and increased its share of total exports to nearly 29%, compared with levels around 22% to 23% in the previous two years. The destination country showing the strongest growth for exports during last year was Russia, reaching 5th place in the ranking.
In Q1 2022, this position showed little change, despite the imposition of sanctions during February due to the invasion of the Ukraine. This is probably due to shipments in Q1 reflecting orders placed pre sanctions, and is likely to show significant falls in Q2. Exports to the Irish Republic showed growth in Q1 compared with 2021 levels, moving in to second place in the destination country rankings, and returned to the position achieved in 2020.

Imports of Equipment by Country of origin
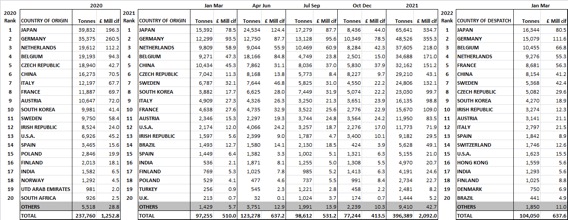
In Q1 2022, UK imports of construction and earthmoving equipment arrived from just under 50 different countries. The table below shows rankings for the Top 20 importing countries based on weight (tonnes) of machines since 2020. In Q1 this year, the Top 20 countries accounted for over 98% of total imports in both weight and value terms.
Similar to previous years, Japan has remained as the leading source for UK imports in Q1 this year on a tonnage shipped basis, while Germany was the leading source on a £ value basis. Between them, the top two countries accounted for 30% of total imports. Imports from France showed a significant increase in Q1, accounting for 8% of total tonnage shipped, compared with 4% during 2021. This moved France up to 5th place in the country ranking, compared with 10th for last year.

Definition of equipment included in the analysis of export and import statistics
The data used in this report is taken from HMRC official trade statistics, and covers construction and earth moving equipment (excluding separate trade data for components and parts). Trade data has been used from 9 different HS (Harmonized System) codes. This consists of the following at the 4 digit level:
8413 – concrete pumps
8426 – cranes
8474 – crushing and screening equipment, and concrete, mortar and other types of mixers
8479 – machinery for public works 8701 – track-laying tractors
8704 – dump trucks for off-highway use
8705 – concrete mixer lorries and pumping vehicles
8429 – construction and earthmoving equipment – including bulldozers, graders, scrapers, loaders, excavators, shovels, tamping machines and road rollers
8430 – pile driving and pile extracting equipment, tamping and compacting machinery


